 |
|||
| HSG |
|
Einfaches GnuPlot-Interface
Hinweis: Noch nicht für Python 3.x angepasst.
# -*- coding: iso-8859-1 -*-
# mk, 21.12.08

# model
import Gnuplot, Gnuplot.funcutils
g = Gnuplot.Gnuplot(debug=1)

# control
def ein(event):
    s = e1.get()
    g(s)


# view
from tkinter import *
f = Tk()
f.title('einfaches Gnuplot-Interface')
f.geometry('300x200')
e1 = Entry(master=f)
e1.insert(0,'splot \'a64a31.txt\' with lines,\'a64a32.txt\' with lines;')
e1.place(x=20,y=20,width=250)
bAdd = Button(master=f,text='führe aus')
bAdd.place(x=20,y=50, width=50)
bAdd.bind('<Button-1>',ein)
f.mainloop()
 plot0.py, a64a31.txt, a64a32.txt
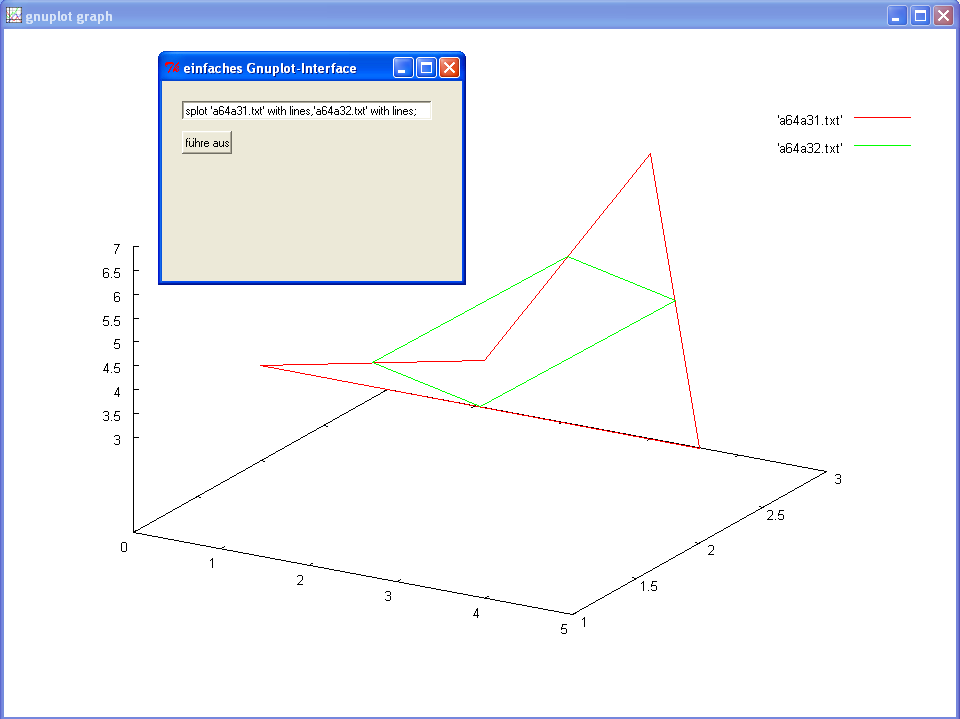
GnuPlot-Interface zu 3D-Darstellungen zur Vektorrechnung
Das Python-Programm plot1.py ermöglicht in Verbindung mit Gnuplot und dem Gnuplot-Python-Interface auf einfache Art, 3D-Darstellungen von Punkten, Linien und Pfeilen zu erzeugen. Das Programm erzeugt temporäre Dateien, dh. man kopiert es zur Benutzung am besten in ein Verzeichnis, wo man Schreibrechte hat und nicht von anderen gestört wird.
Zur Erinnerung: Gnuplot erlaubt, die jeweilige Ansicht mit der Maus zu variieren.


Installation
- Installation von GnuPlot
- Installation von NumPy
- Herunterladen und Auspacken von Gnuplot.py
- Sicherstellen, dass unter Arbeitsplatz/Eigenschaften/Erweitert/Umgebungsvariablen die Variable 'path' um den Eintrag 'C:\programme\Python25' (oder entsprechend) erweitert ist
- Im temporären Verzeichnis 'gnuplot-py-1.8' in der Kommandozeile 'python setup.py install' eingeben
- In der Datei 'C:\Programme\python25\Lib\site-packages\Gnuplot\gp_win32.py' (Pfad entsprechend) den Pfad zu pgnuplot.exe einstellen, etwa gnuplot_command = r'C:\Programme\gnuplot\bin\pgnuplot.exe'